Expansion 
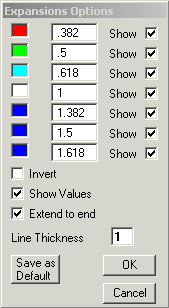
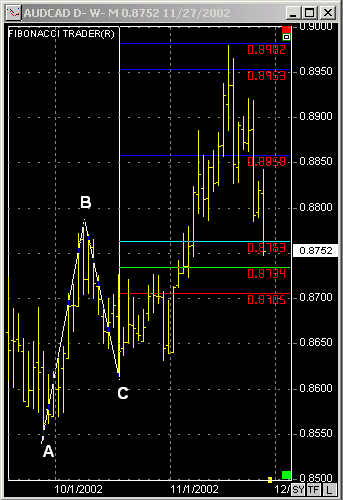
Draw a line (A-B) connecting a major top and bottom then click a third point (C). This will create the expansions of the range A-B plotted from point (C). The expansions are defined in the Expansions Options window. In this window you can also change the color and thickness of the lines as well as select which lines to show and whether you want to extend the expansions to the end of the chart.

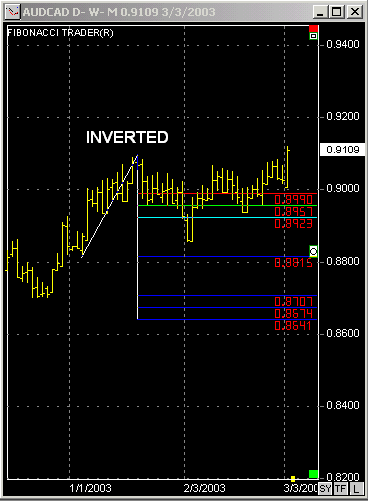
Options to draw the values inverted and to show the actually values of each line.


Draw a main line from A to B, click on a third point C, the Daniel Lines will be drawn.
Since 1992