USING EXCEL TO CREATE YOUR OWN INDICATORS
version 4.00 or later, last tested on Microsoft Excel 2020.
The program will send data to an Excel workbook and then receive information to be plotted or even post trades.
If you are going to create indicators for Real Time calculation then this is an Important considerations. This is a slower process than a direct DLL creation(see how to create your own DLL indicators). A I7 CPU 3GHz or better with a minimum of 8 GB of memory is strongly recommended. The program sends the number of bars in memory to the Excel sheet. Keep this number as low as possible.
Lets look first at the example file that comes with the program. This file is located at C:\FTGT\EXCEL\EXAMPLE.XLS. There is another example file named C:\FTGT\EXCEL\PAINTBAR.XLS as well.
Use Excel to open C:\FTGT\EXCEL\EXAMPLE.XLS.
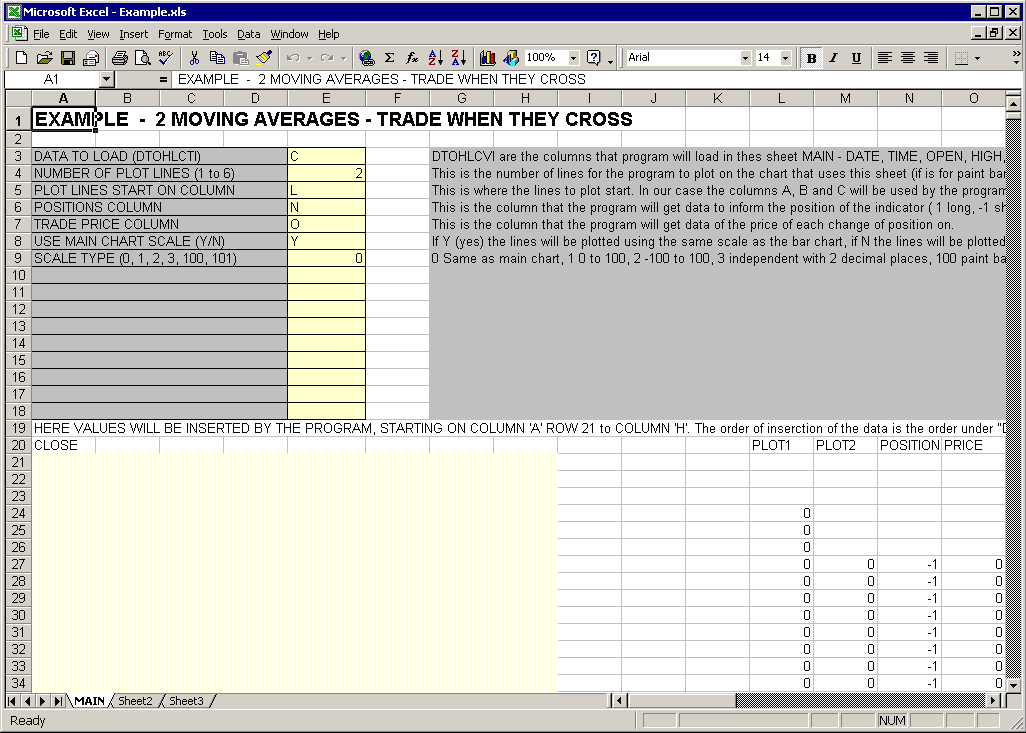
In this case we are creating and indicator that has 2 moving averages, when the lines cross we have a trade.
The cell E3 to E18 are reserved for you to pass some needed information from excel to the program.
The following is a description of each cell.
E3
enter the type of data you want the program to load into excel. In this case
C will load just the close data. The data is then always loaded from cell
A21 down. If you had typed DOHLCVT in cell E3 the program would load the Date
values in column A, the Open values in column B, the High values in column C,
the Low values in column D, the Close values in column E, the Volume values in
column F, the Tick Volume in column G and the Open Time of current bar in
column F.
The program will load the symbol data in the order of what is typed
in cell E3. For example, if you typed HL in cell E3 the program would load
the Highs in column A and the Lows in column B. LH would cause the program to
load the Lows in column A and the Highs in column B.
E4
enter the number of lines to be plotted for this indicator. You can plot
up to 6 lines. In this case, 2 lines are to be plotted. The formulas you write
for line 1 of your indicator will be entered into the column you select in
cell E5, in this case column L.
This example column M contains a formula that will
calculate the average of the last 4 closing prices. The columns containing the
formulas for your indicator must be next to each other. In this case, the
formula for line 2 of the moving average (in this example, the average of the
last 7 closing prices) is entered in column M. If you had a 3rd
line to be plotted the E4 cell would have the value 3 and the formulas for the
lines to be plotted would be in columns L, M and N.
E5
enter the column where line 1 of your indicator is to be plotted. In this
case, column L.
E6
enter the column where you will enter the formula used to initiate and exit
positions (i.e. entry and exit rules). In this case the formula is enter in
column N.
If you want entry and exit arrows to show on your chart then write
your formula so that it will generate the values 1 for long, -1 for short and
0 for flat.
In this example, we have if column L (the average of the last 4
closes) is greater than column M (the average of the last 7 closes) then the
indicator is long (1) otherwise the indicator is short (-1).
If your
indicator can have a flat position fill the cell where the indicator is flat
with 0.
E7
for trade price, enter the column in which the results from the position
column will be displayed, In this case column O. If the position from column N
changes then the trade price in column O will be updated. In our example as
column N changes position we save the resulting trade price in column O.
E8
enter Y if the plotted lines have the same scale as the main bar chart or N if
the plotted lines have a different scale than the main bar chart. (see E9).
E9
If E8 is set to N then use E9 to enter the correct scale.& Your scale options
are: 0 = same as bar chart. 1 = from 0 to 100. 2 = from -100 to 100. 3 =
independent with 2 decimals.
100 = paint bar indicator (if plot value is 1
then paint using color1. If plot value is 2 then paint using color2).
101 = paint bar indicator (if plot value is 1 then paint using color1.
If plot value is 2 then paint using color2. If plot value is 3 then plot half of bar using
color1 and the other half using color2).
For Paint Bar 100 and 101 the program will only use the values for 1 plot line -
the one that is under "PLOT LINES START ON COLUMN”.
See the example in file C:\FTGT\EXCEL\PAINTBAR.XLS
To use this example indicator open the indicators window and scroll down the list until you find the indicator called EXCEL
Highlight “EXCEL” and click ADD (or just simply double left click on the excel indicator). The default is set to the EXAMPLE indicator. When you create your own excel indicators click on edit and change the Excel file name box to the name you gave your excel indicator.
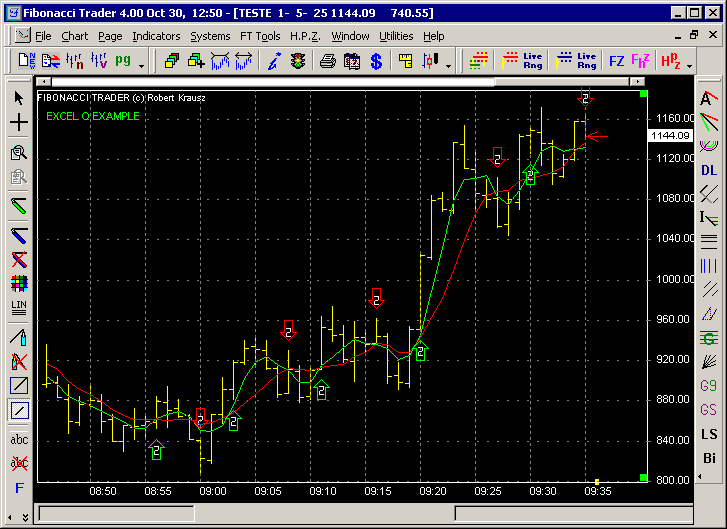
If your Excel indicator is designed to initiate trading positions you can see the generated signals on the chart by clicking on the Alarm/Result tab and check “Show trades on chart”. All Excel Indicator files must be saved in the following folder: C:\FTGT\EXCEL.
The next picture shows a chart using the Excel “Example” indicator.
Since 1992