Chart Types
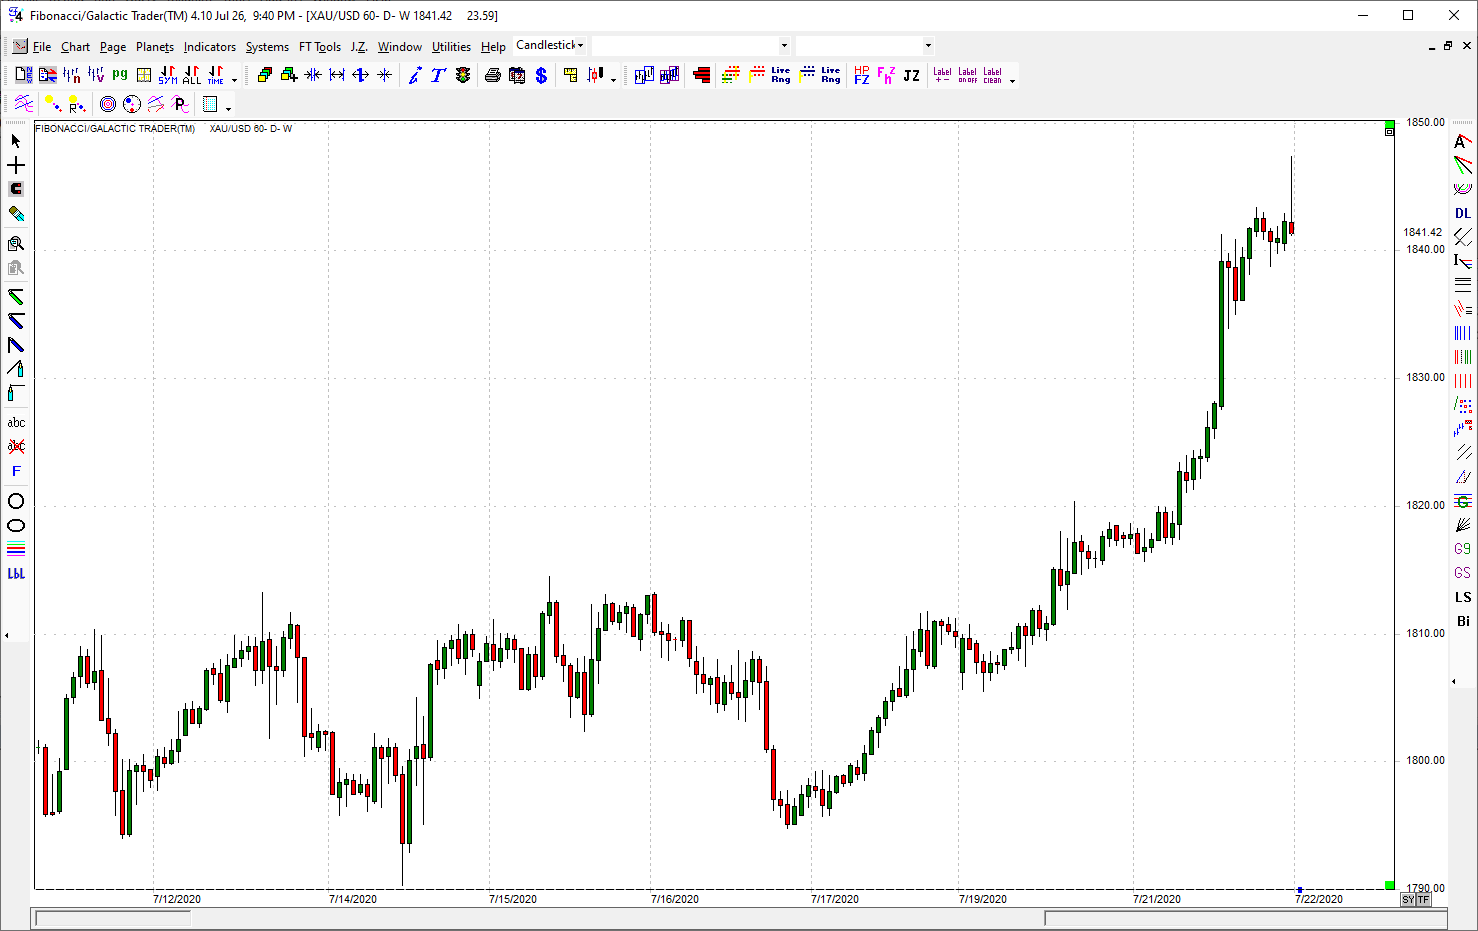
Regular chart - minutes, daily and weekly bars. These are the most common bars. Daily, weekly and monthly are available on all our program, minute available on all our real time programs. Showing bar type candlestick.
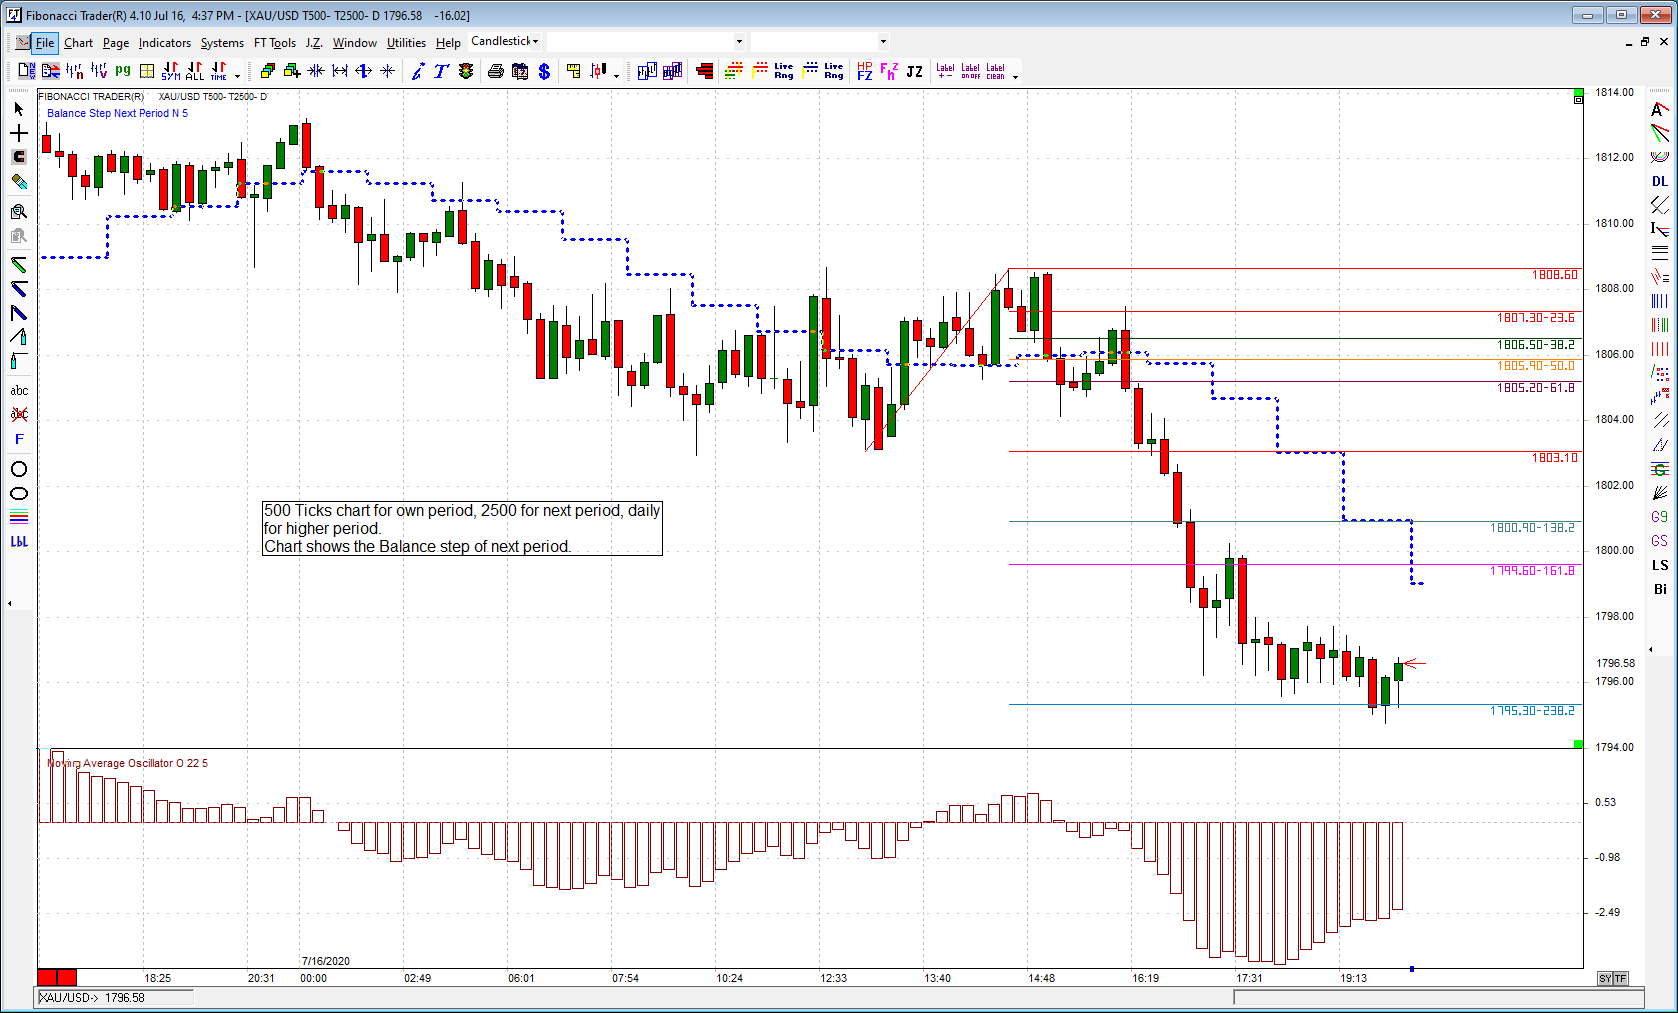
Tick chart - in this type of chart a bar will close when the volume of ticks reaches the number of ticks set by the user. Avalilable on all real time versions, on Fibonacci and Fibonacci/Galactic Trader you can set the 2 higher time frames as tick chart or set as daily, weekly...
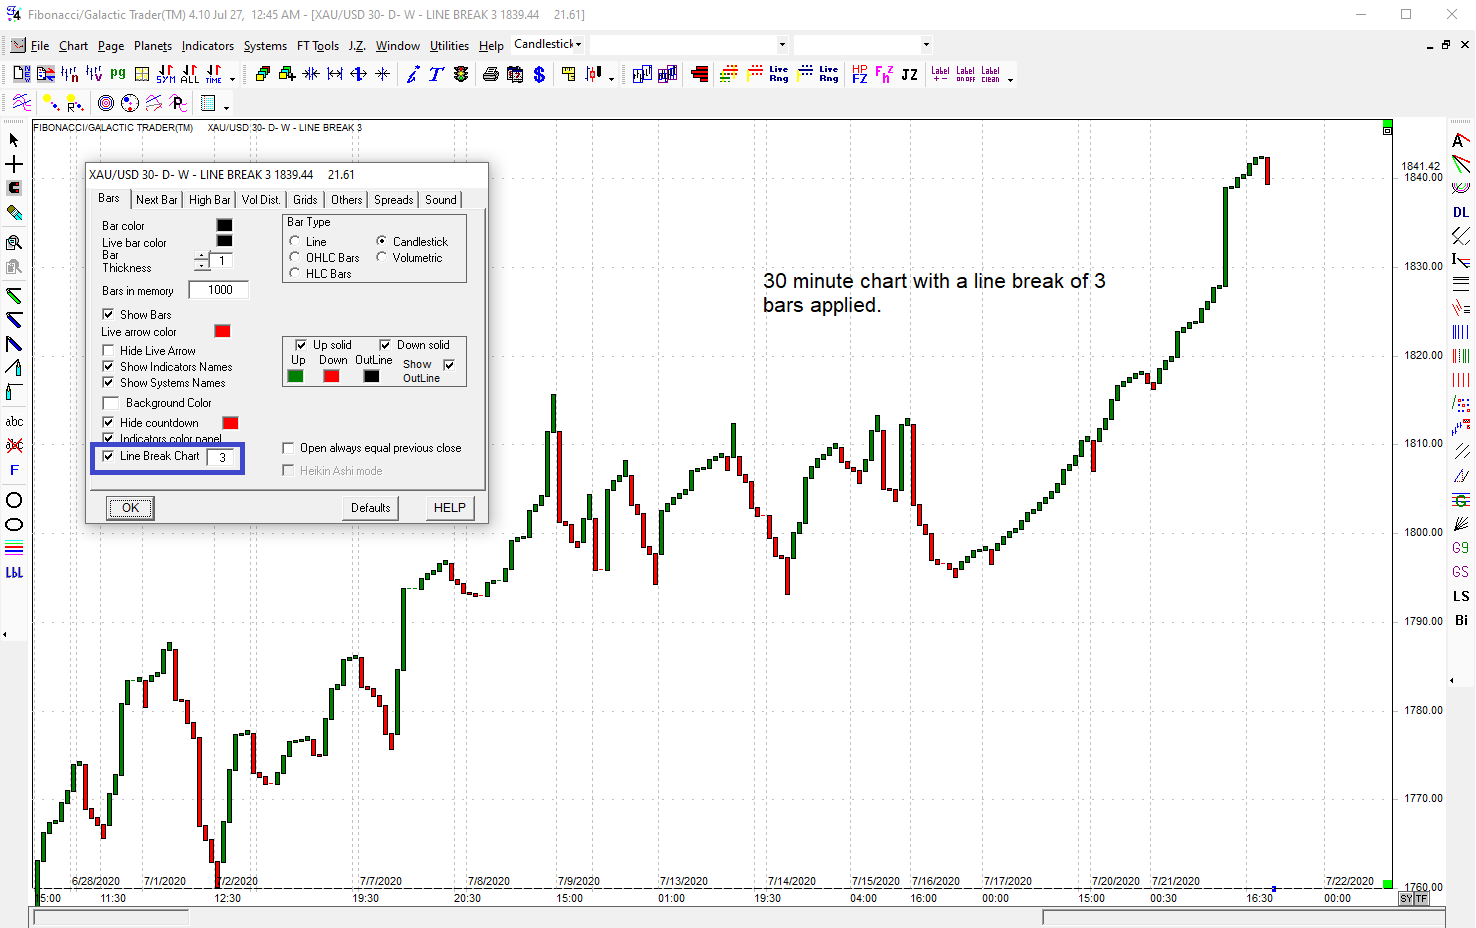
Line break chart - you can apply this on any bar chart. A new bar down will start after a market going up only when the price goes below the precious N bars lows. A new bar up will start after a market going down only when the price goes above the precious N bars highs. Avalilable on all programs.
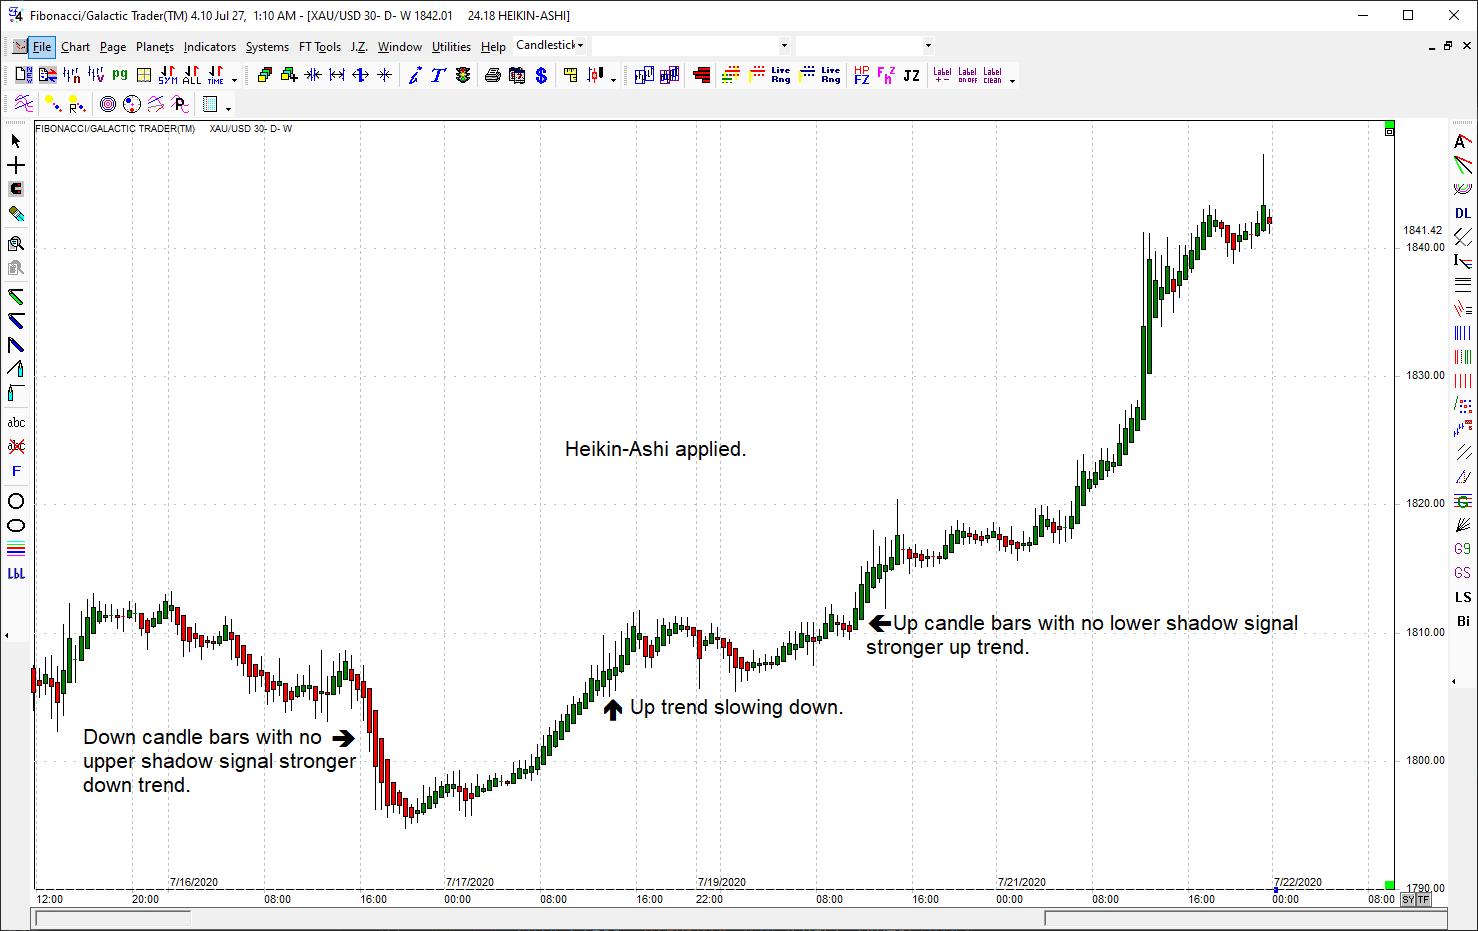
Heikin-Ashi chart - is a bar calculation modifier, used by technical traders to identify a trend more easily. Avalilable on all programs.
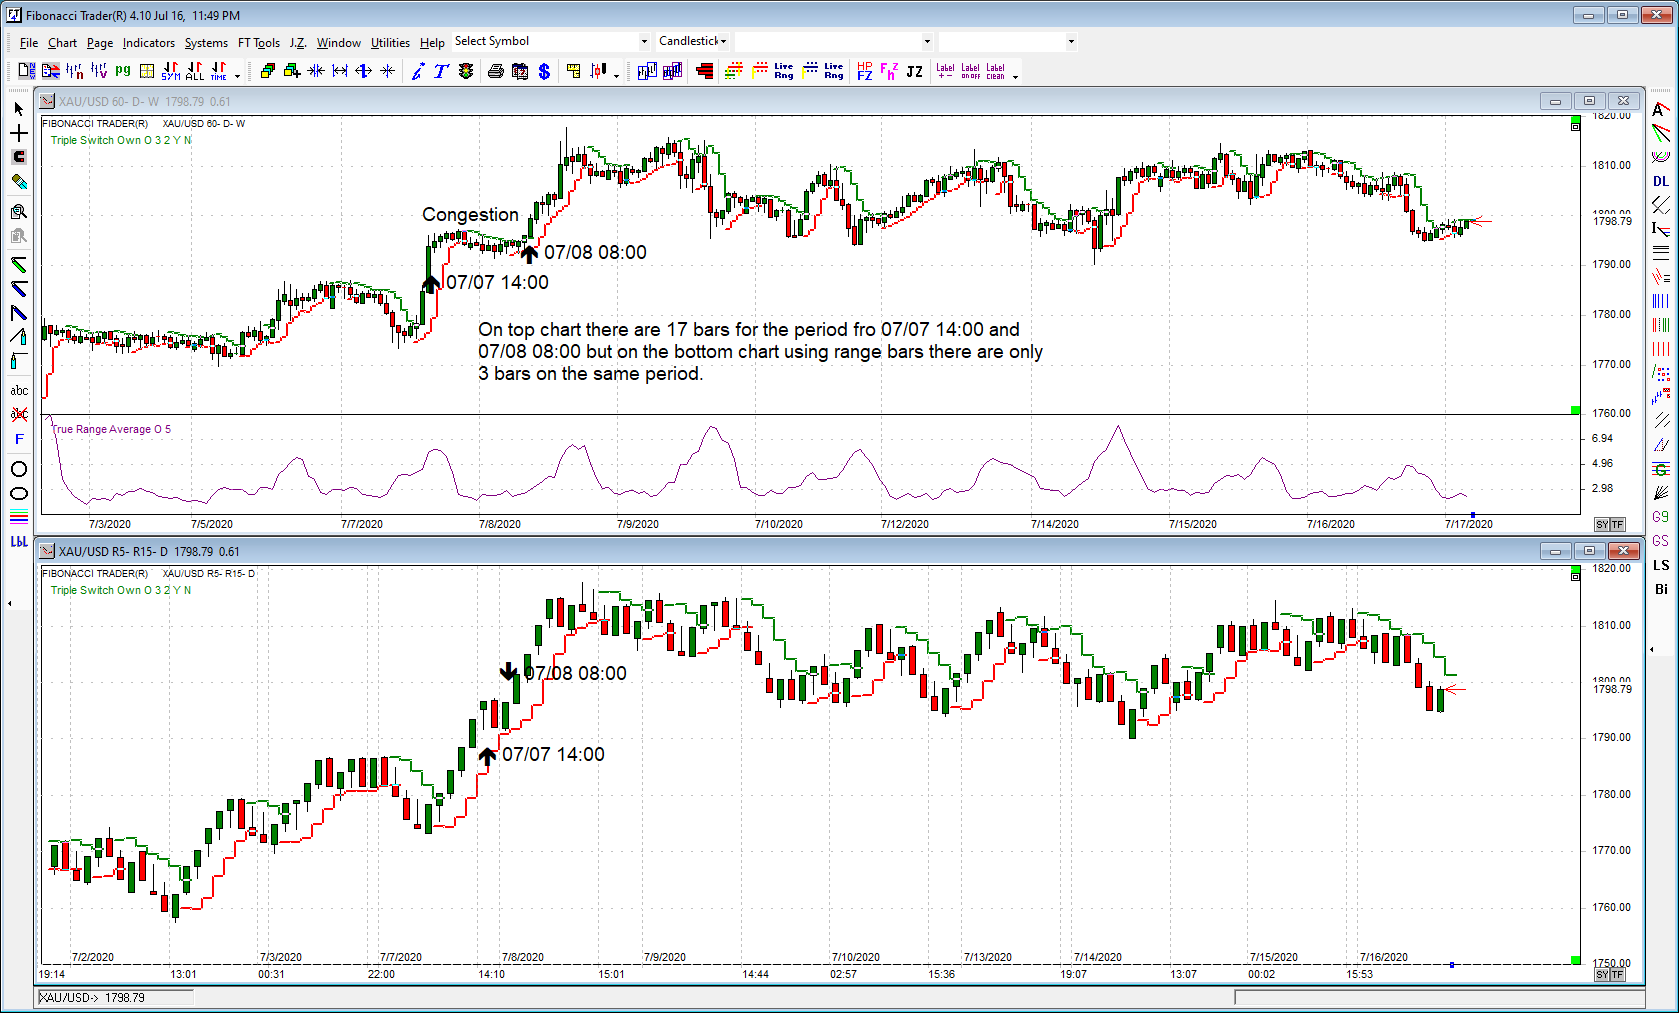
Range bars chart - in this type of chart a bar will close when the range of the bars (high-low) reaches the range set by the user. Avalilable on real time Fibonacci and Fibonacci/Galactic Trader, you can set the 2 higher time frames as range bars chart also or set as daily, weekly... You can create the range bars based direct on the tick data or on 1 minute data.
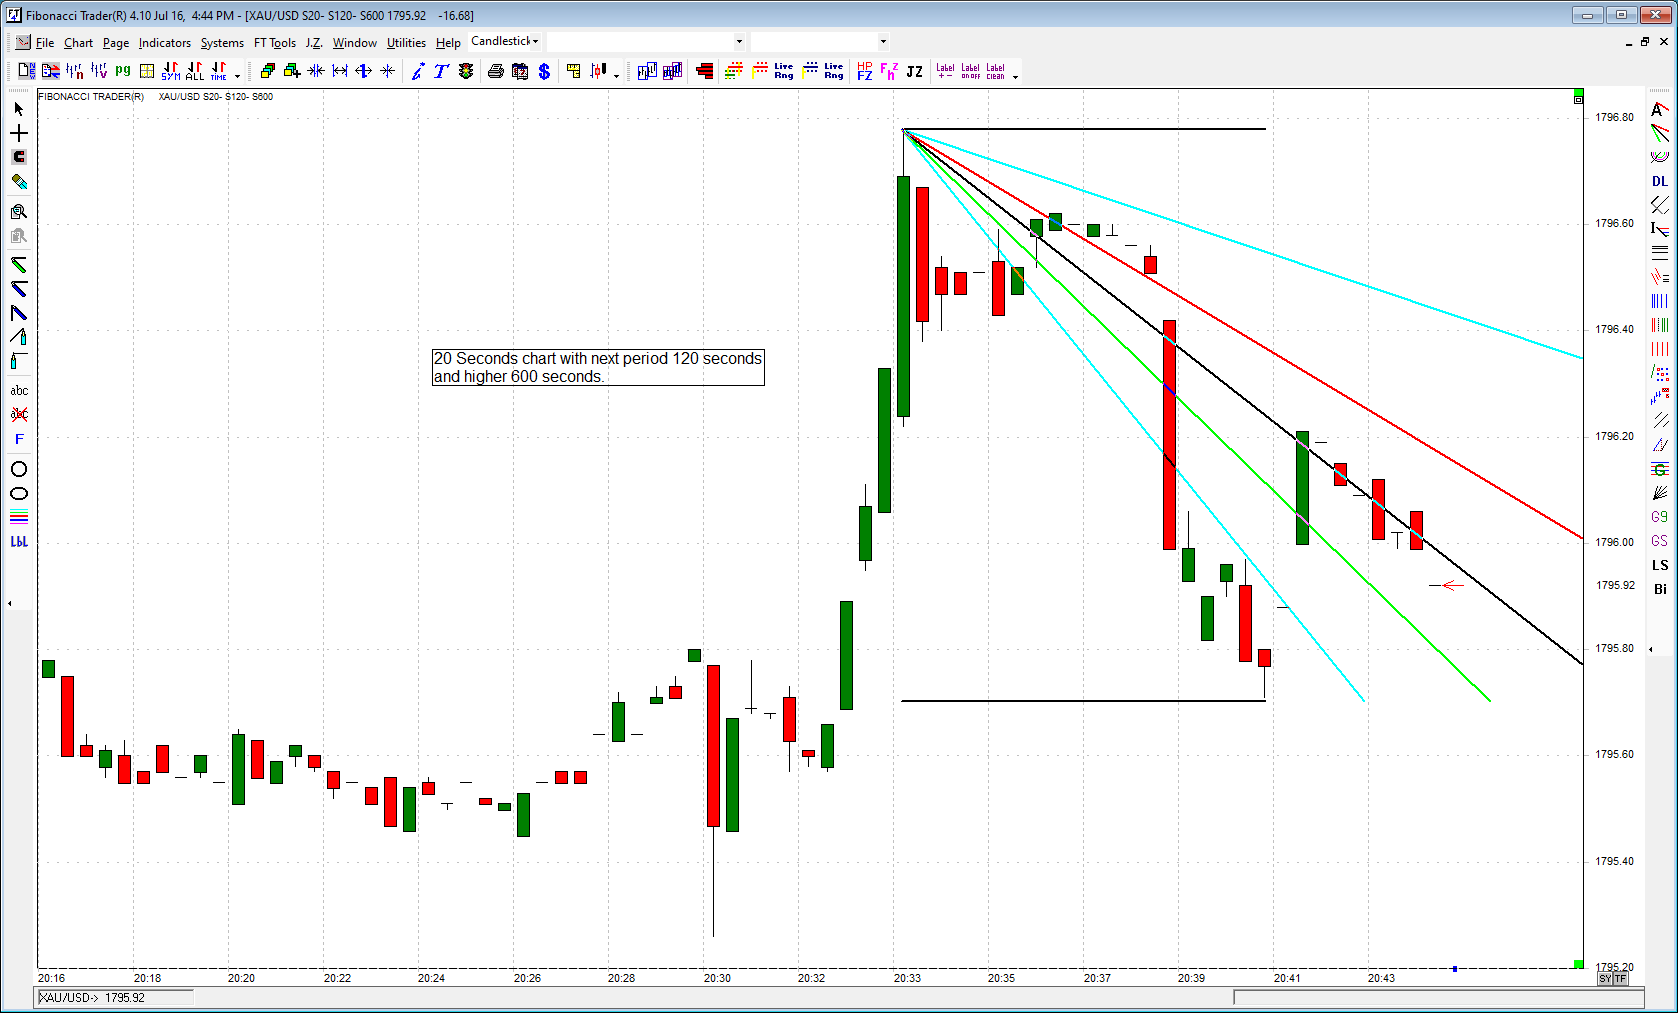
Seconds bars chart - in this type of chart a bar will close when the a number of seconds set by the user is complete. Avalilable on real time Fibonacci and Fibonacci/Galactic Trader, you can set the 2 higher time frames as seconds bars chart also or set as daily, weekly...
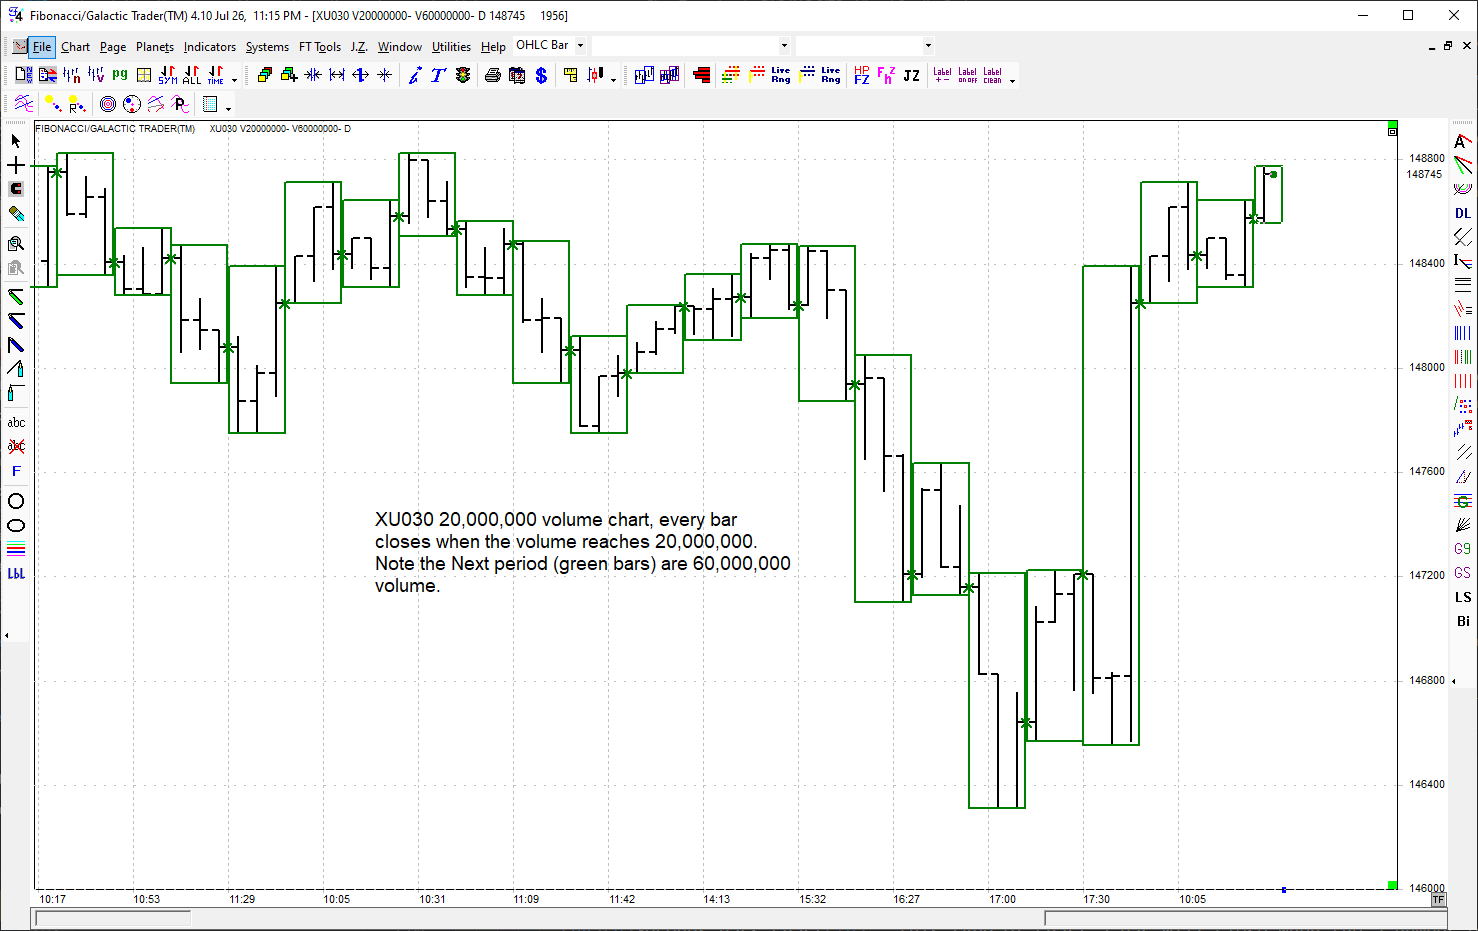
Volume chart - in this type of chart a bar will close when the volume of the bar reaches the volume set by the user. Avalilable on all real time versions, on Fibonacci and Fibonacci/Galactic Trader, you can set the 2 higher time frames as volume chart or set as daily, weekly...
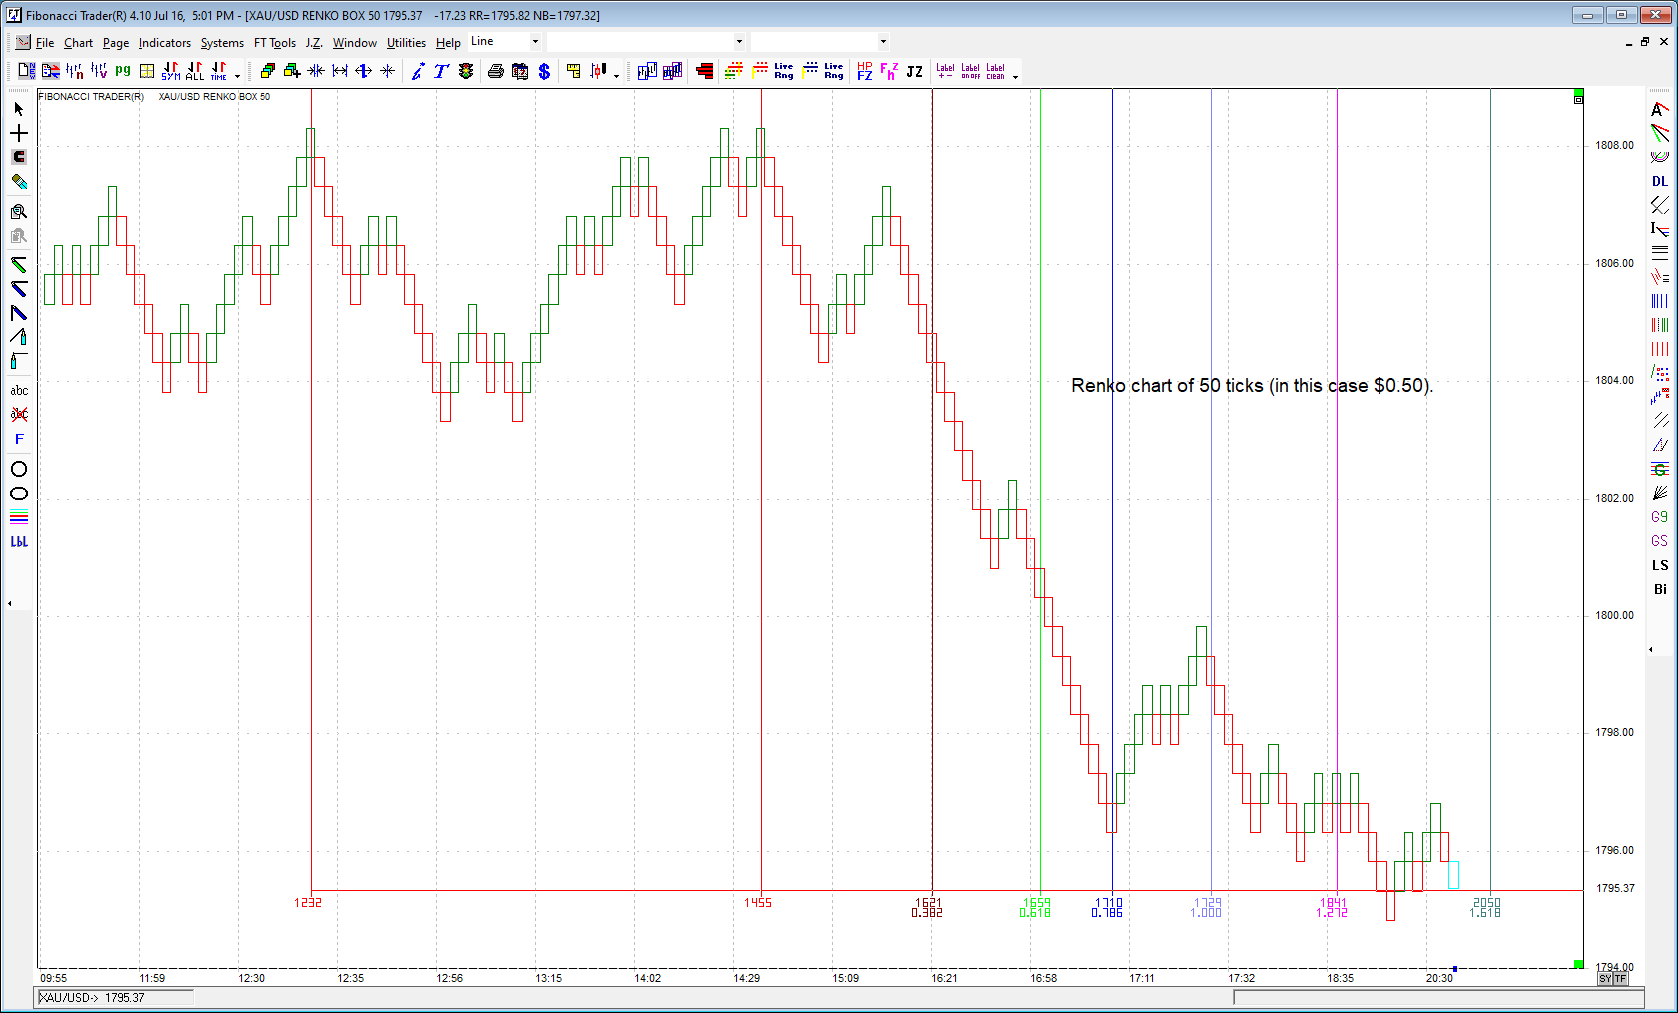
Renko bars chart - in this type of chart a bar will close when the market moves the number of ticks requested. As an example on a 10 ticks renko where a tick size is 10 cents a bar will close and a new bar will open when the market moves a full dollar above the previous bar high or a full dollar below the previous bar low. Note the new bar cannot be defined until is closed. Avalilable on real time Fibonacci and Fibonacci/Galactic Trader, this type of chart has no next or higher periods.
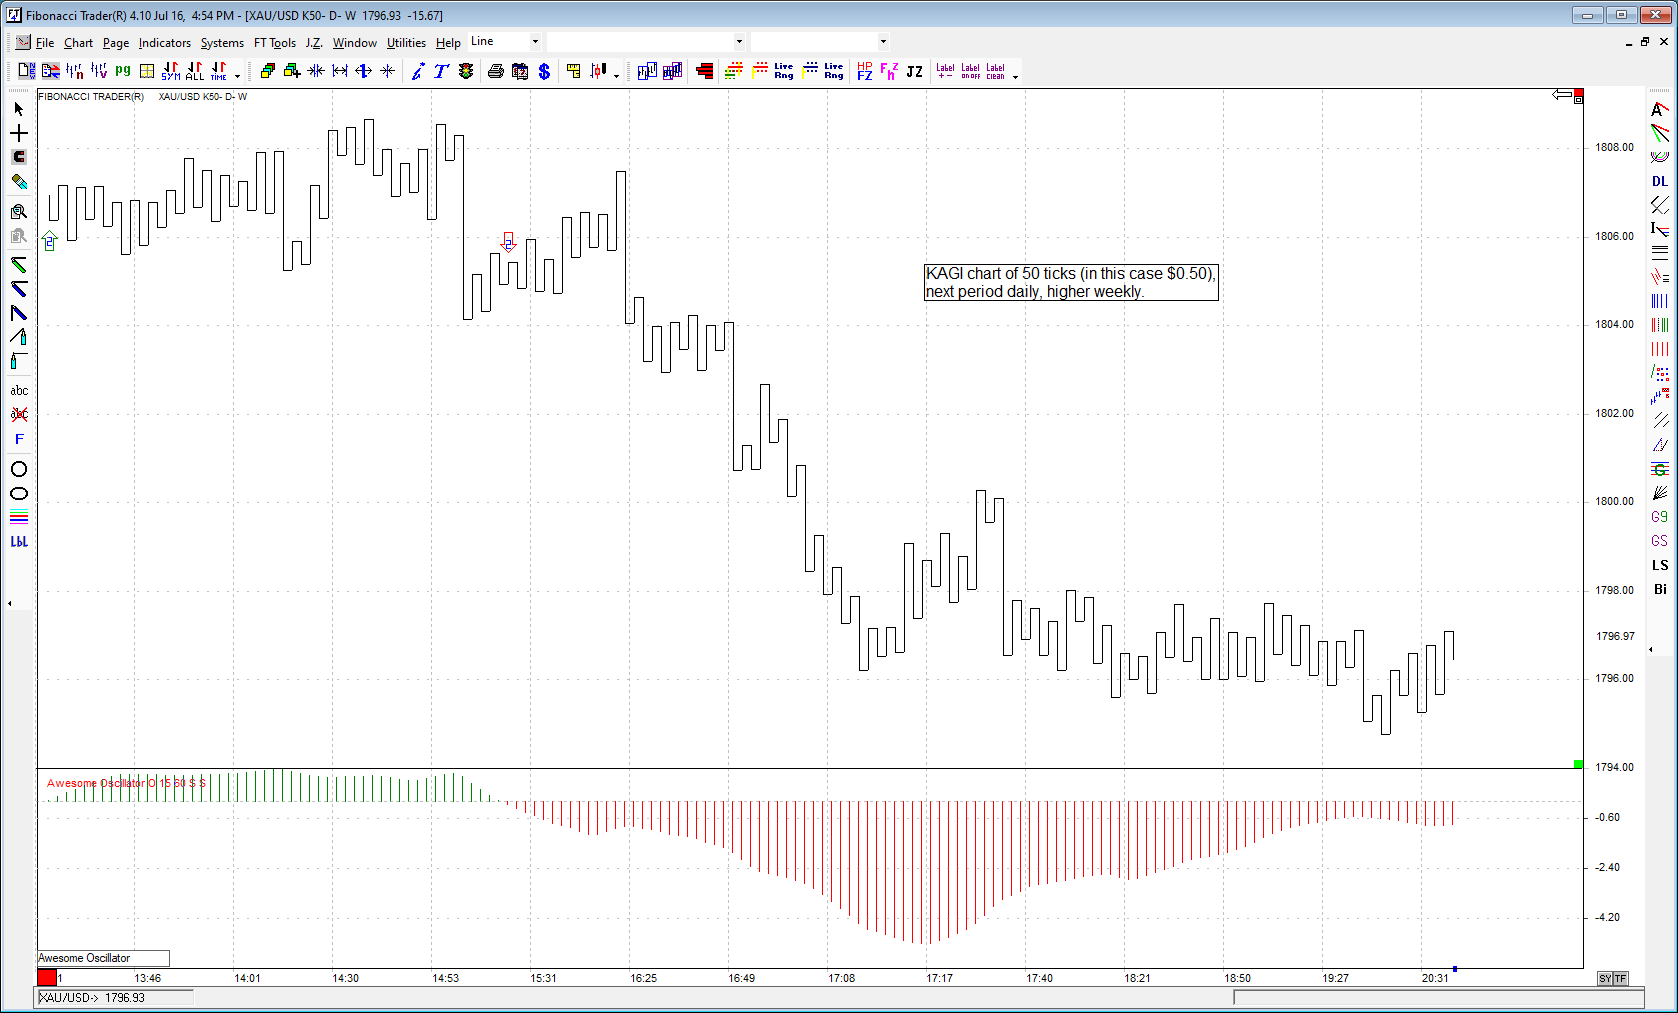
Kagi bars chart - in this type of chart the direction of the line will change when the market turns by the defined number of ticks. Then as long the market goes in one direction the line will continue to grow on that direction, when it turns by n ticks then a new line in the other direction is created. Avalilable on real time Fibonacci and Fibonacci/Galactic Trader.
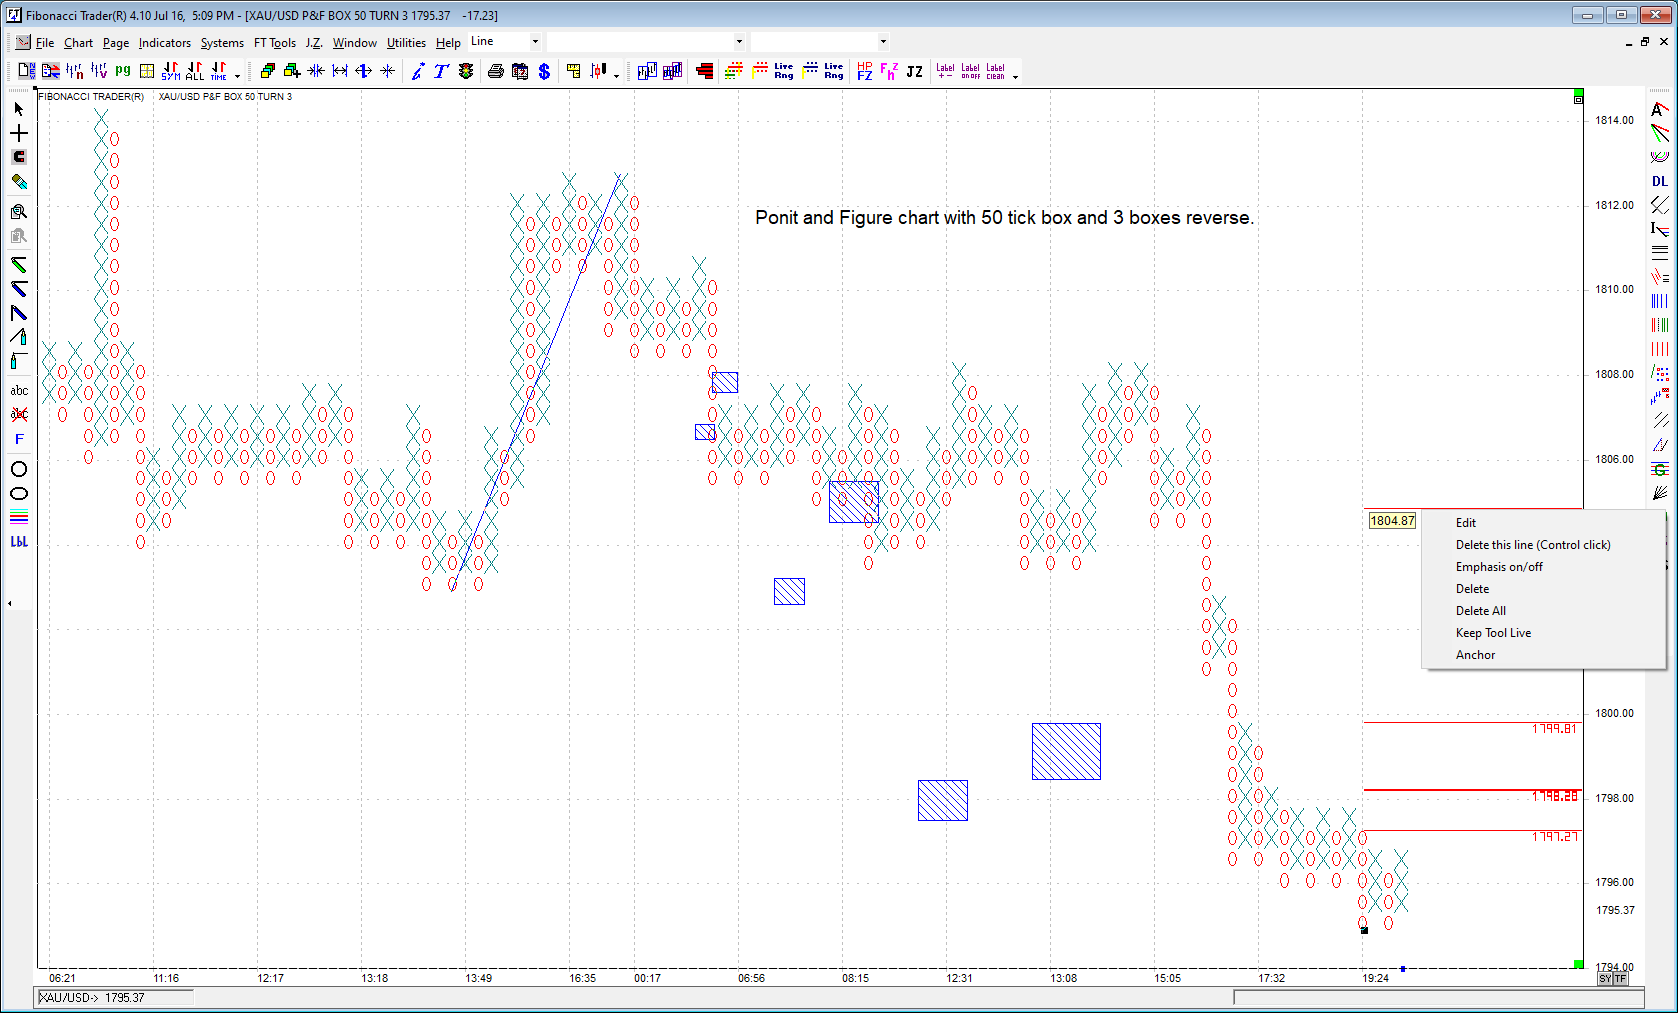
Point & Figure chart - in this traditional type of chart the direction of the chart will change when the market turns by the defined number of boxes, each box is defined by a set number of ticks. The up market is draw with circles and the down market with X's. Avalilable on real time Fibonacci and Fibonacci/Galactic Trader.
Since 1992